01
Business Intelligence
First dashboard in daily use: 4–6 weeks
- Profitability by customer, product, market and season
- Cost control and variance against standard costing
- Reports that send themselves every Monday
2025/26 seasonFresh produce Business Intelligence
You know the kilos.
You don't know which
ones made money.
The ERP holds the kilos. The sales rep's spreadsheet holds the prices. The packhouse one holds the shrinkage. Nobody has the margin on a single screen.
Season report/extract
W42
| Lot | Variety | Size | Kg | €/kg | Margin |
|---|---|---|---|---|---|
| 24-118 | Clemenules | 3/5 | 18,420 | 1.24 | +11.4% |
| 24-119 | Nadorcott | 2/4 | 12,960 | 1.86 | +18.2% |
| 24-121 | Navelina | 4/6 | 24,310 | 0.91 | −2.7% |
| 24-124 | Fino lemon | 3/5 | 6,480 | 2.05 | +23.9% |
| 24-127 | Bell pepper | G | 31,750 | 1.12 | +4.1% |
Demo data. That −2.7% on Navelina is the kind of finding that only shows up when kilos, price and real cost per lot sit in the same table.
§ 01How it really works
Five scenes from any given week in your packhouse and your sales office.
The season closes in March.
What would have changed it was decided in November.
You know which customer pays the best price.
Not which one leaves most margin after shrinkage, packing, freight and credit notes.
The profitability report is three days of copy and paste.
ERP, the sales spreadsheet, the packhouse one and the cost one. Every month, again.
The crop estimate is the field technician's best guess.
When it misses, the supply programme pays for it.
Two people work out the same costing.
Two different numbers, and the meeting is spent arguing which one holds.
The problem isn't missing data. It's that none of it talks to the rest.
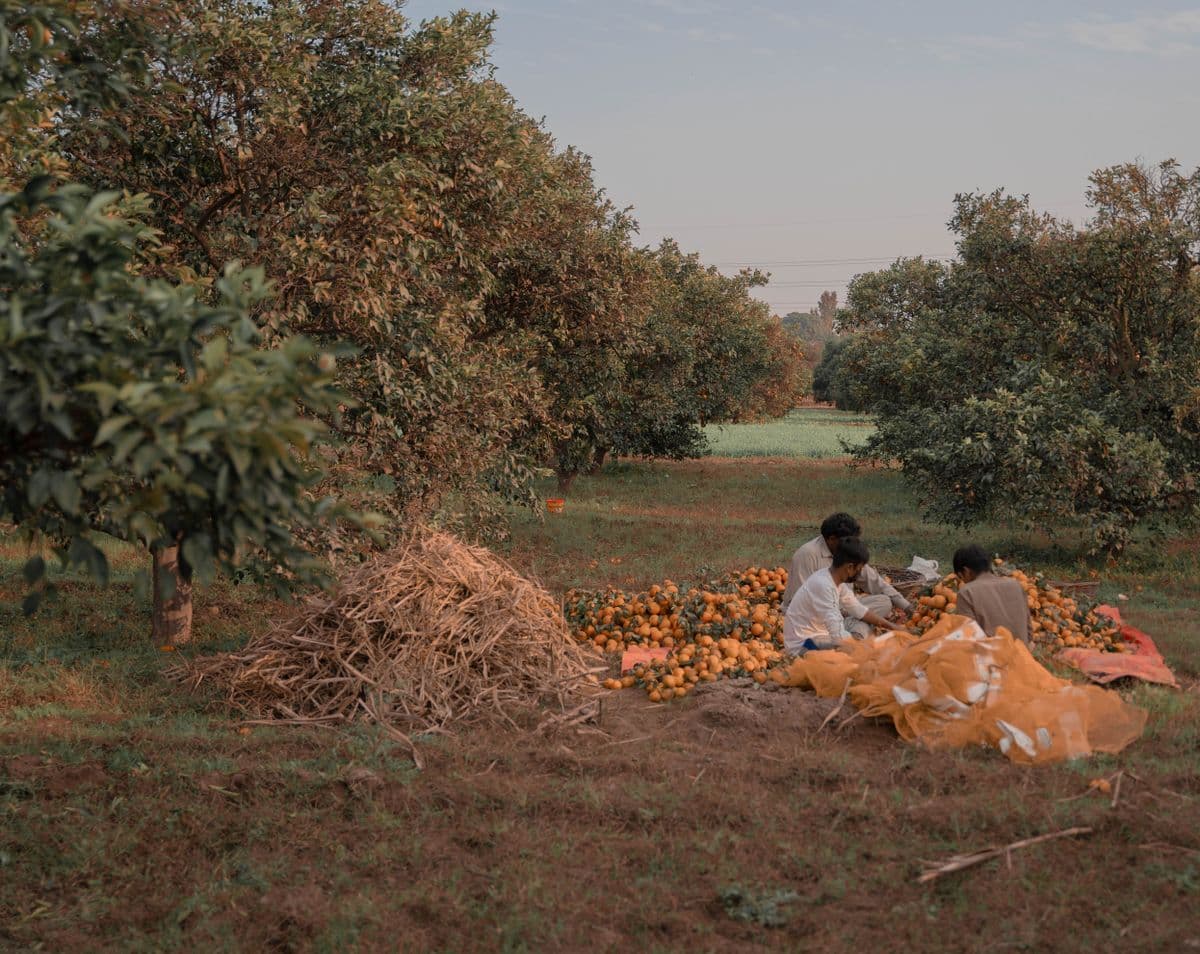
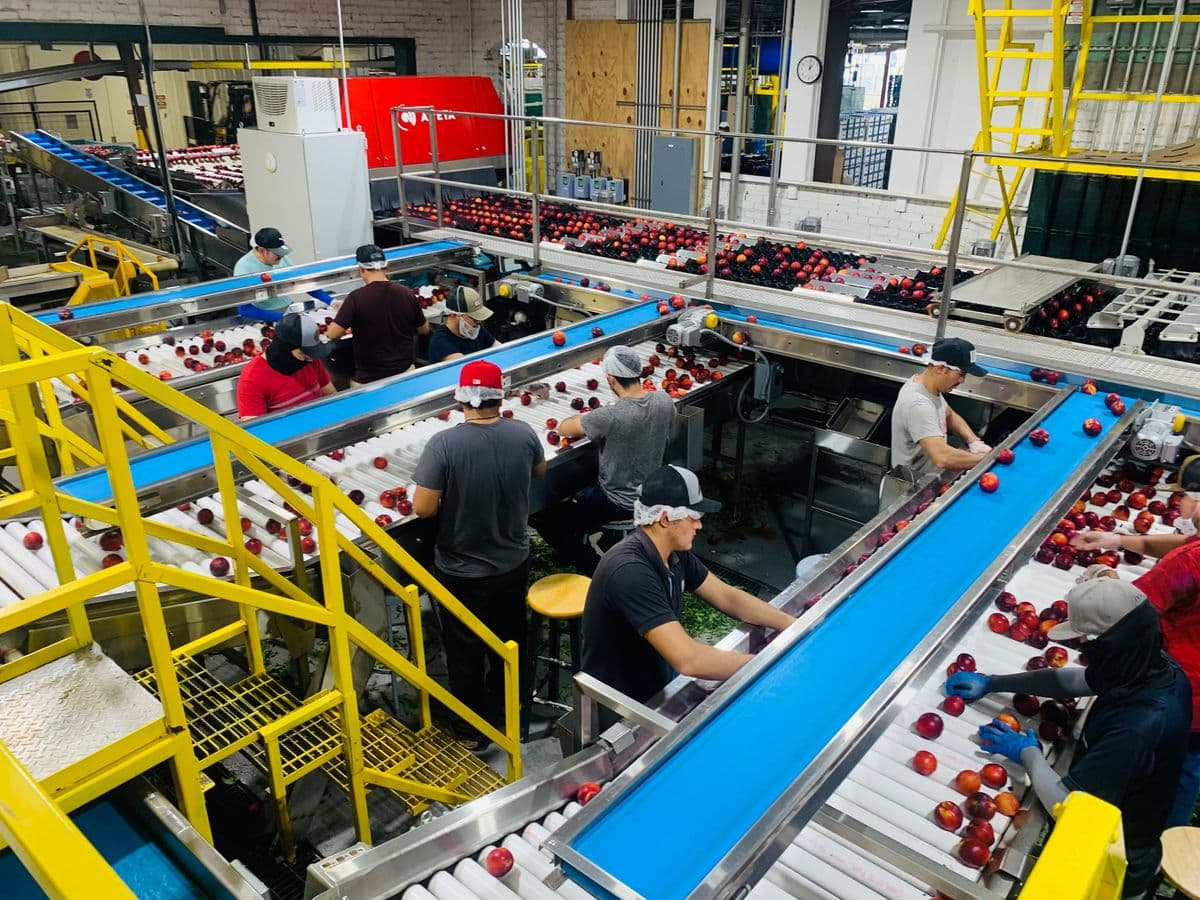
All of this happens somewhere very specific. And that place is already producing the data.

§ 02From the field to the board
A data project doesn't start with the chart. It starts with getting everything to refer to the same lot.
Source 01
Field books, agri ERP
Source 02
Packing software, weighbridges
Source 03
ERP, spreadsheets, email
Source 04
Forwarders, temperature loggers
Middle layer
One data model, updating itself
ETL/ELT, lot-level traceability and the same definitions of margin and shrinkage for everyone.
Output
Same question, same number, in seconds.
§ 03What we build
We don't sell dashboards. Reliable data first, visualisation second, and only then prediction.
01
First dashboard in daily use: 4–6 weeks
02
Phase 1 of nearly every project
03
Needs 2–3 seasons of usable history
04
Tackled process by process, 2–4 weeks each
05
Usually phase 3, once the model is solid
§ 04Two concrete examples
Two demo dashboards. The data is invented; the structure and the questions are those of a real marketing company.
2025/26 season · fictional data
Gross margin, season
1,842,600€
+6.4% vs 24/25
Average price
1.18€/kg
−3.1% vs 24/25
Average shrinkage
7.4%
−0.9 pp vs 24/25
Kg packed
14.2M kg
+2.8% vs 24/25
After shrinkage, packing, freight and credit notes
€/kg · zero is the centre line
| Channel | €/kg |
|---|---|
| Retail DE · programme | +0.34 |
| Retail NL · programme | +0.27 |
| Wholesale FR | +0.19 |
| Retail UK · spot | +0.14 |
| Processing / fresh-cut | +0.08 |
| Domestic wholesale | +0.03 |
| Third-country export | −0.06 |
| EU discount | −0.12 |
€/kg, weighted average
| Week | €/kg |
|---|---|
| W38 | 0.21 |
| W39 | 0.18 |
| W40 | 0.24 |
| W41 | 0.26 |
| W42 | 0.22 |
| W43 | 0.15 |
| W44 | 0.11 |
| W45 | 0.14 |
| W46 | 0.19 |
| W47 | 0.23 |
| W48 | 0.28 |
The question it answers: discount buys a lot of volume and sits near the top of the kilo ranking. Once real shrinkage, packing and freight are charged to it, it leaves −0.12 €/kg. The ERP never shows you that.
Model trained on 3 seasons · fictional data
Mean forecast error
6.8% MAPE
−2.4 pp vs manual method
4-week forecast
3,360t
Dominant size forecast
2–3
Tonnes packed per week. The forecast runs four weeks beyond the last actual.
| Week | Actual (t) | Forecast (t) |
|---|---|---|
| W40 | 980 | 1,010 |
| W41 | 1,240 | 1,190 |
| W42 | 1,520 | 1,480 |
| W43 | 1,780 | 1,820 |
| W44 | 1,910 | 1,880 |
| W45 | 1,840 | 1,800 |
| W46 | 1,620 | 1,660 |
| W47 | 1,380 | 1,420 |
| W48 | — | 1,180 |
| W49 | — | 940 |
| W50 | — | 720 |
| W51 | — | 520 |
% of kilos packed. Sizes are ordered, so the colour is too: one hue, dark to light.
| Week | Size 1 | Size 2 | Size 3 | Size 4 | Size 5 |
|---|---|---|---|---|---|
| W40 | 5% | 12% | 28% | 34% | 21% |
| W41 | 6% | 14% | 30% | 32% | 18% |
| W42 | 8% | 17% | 31% | 30% | 14% |
| W43 | 10% | 20% | 32% | 27% | 11% |
| W44 | 13% | 23% | 32% | 23% | 9% |
| W45 | 16% | 26% | 31% | 20% | 7% |
| W46 | 19% | 28% | 30% | 17% | 6% |
| W47 | 22% | 30% | 29% | 14% | 5% |
The question it answers: if you're going to have 30% size 2 in three weeks, that programme with the German multiple can be closed today. And if you're not, better to know before signing it.
Both dashboards use demo data generated for this presentation. On a real project they are built on the systems you already have.
§ 05Who runs it
“I've sat on both sides of the table: the one that grows and packs, and the European buyer who calls on a Tuesday to move an entire programme.”

Project director
My job here isn't to write code. It's to translate “I don't know which customer makes me money” into a brief the technical team can build without guessing.
Every project adds specialists as needed. They are not permanent staff and they are not interns. How the network works.
§ 06How we work
The whole plan, in real weeks from kick-off.
00Diagnostic
No charge
01Data model
The phase that decides whether the project works
02First dashboard
Delivered in use, not in a presentation
03Automation
Process by process
04Prediction
Once there's clean history
00Diagnosticwk 1
No charge
01Data modelwk 2–6
The phase that decides whether the project works
02First dashboardwk 6–9
Delivered in use, not in a presentation
03Automationwk 8–13
Process by process
04Predictionwk 13–16
Once there's clean history
Phase 00
Scope, timeline and a fixed price
You bring
Two meetings
Phase 01
One model, refreshing itself
You bring
Someone who can settle definitions
Phase 02
Dashboard in production
You bring
Two people who actually use it
Phase 03
Automated processes and alerts
You bring
Which task burns the most hours
Phase 04
A trained model with measured error
You bring
One season of patience
If you say no after the diagnostic, the document is yours to keep.
§ 07Get started
The diagnostic is free and ends in a document with scope, timeline and price. If you say no, the document stays with you.